Performance Testing
Types of Performance Testing
Load Testing
Stress Testing
Volume Testing
Capacity Testing
Spike Testing
Scalability Testing
Load: Testing speed of the system while increasing the load gradually till the customer expected number.
Stress: Testing speed of the system while increasing/reducing the load on the system to check any where its breaking.
Volume: Check how much volumes of data is able to handle by the system.Performance Testing process

Why load testing?
It evaluates the stability, speed or capacity of the system or component through response time in the application.
Test Details:
We will determine how many number of user access the website in reputed time. In test, we have defined number of Concurrent users targeting the application randomly.
What are the Tools available for Load Testing ?
- JMeter
- Postman
- Tsung
- Blazemeter
- Soap UI
Why Jmeter ?
JMeter is a software developed by Apache and its main
objective is Open Source tool due to its ability to support huge number of
simultaneous users from a single machine or cluster of machine.
Can do testing on different server types - HTTP, HTTPS, SOAP, Database via JDBC, LDAP, JMS,
Mail - POP3(S) and IMAP(S).
Jmeter is Java oriented
application designed to load test functional behavior of the website and
measure performance of the web application.
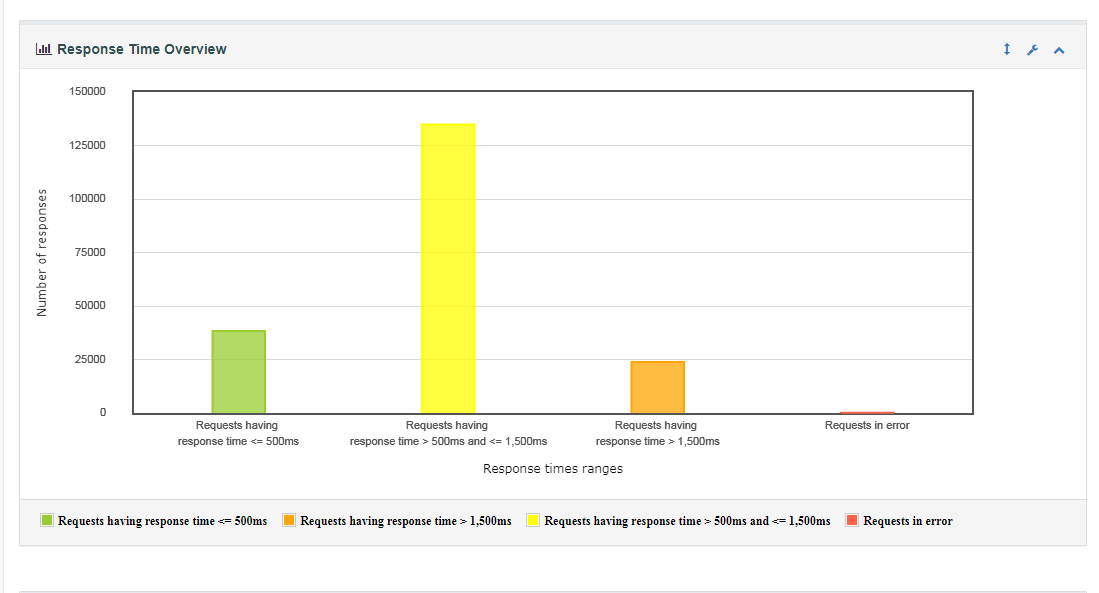
Jmeter results are generated in HTML format report and
displays the summary of the test run.
Provides the total number of users performed action in
reputed time and also percentage of pass and fail responses with graphical
charts also available.
Supported OS : Linux/Ubuntu/CentOS, Mac, Windows
Configuration and Execution of Load Test
Load
Testing performed by hitting the application of API in Jmeter by setting the
Number of users (Thread) and duration of the time to hit the API.
For
Example:
Number
of Users : 1000
Duration
: 300
seconds
From
above inputs, ‘n’ number of users started to access (hit) the api and
continuously users hit the api and receive the responses.
Following are the common method types
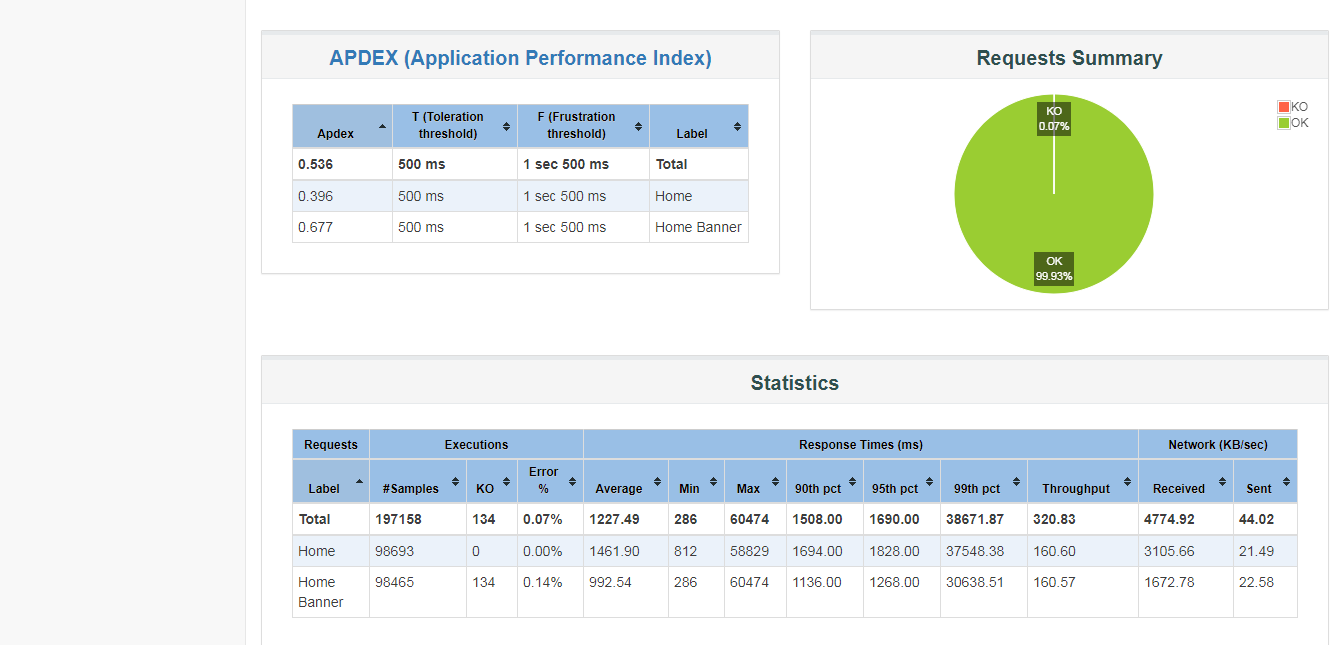
Summary Report

# Samples is the number of samples with the same label.
# Average is the average time of a set of results.
# 90% Line (90th Percentile) meaning 90% of the samples took no more than this time.
# Min is the shortest time for the samples with the same label
# Max is the longest time for the samples with the same label
# Error % is the percent of requests with errors
# Throughput is measured in requests per second/minute/hour.
# Kb/sec - throughput measured in Kilobytes per second. Time is in milliseconds.
In the View Results Tree after run to check the exact response for the given request & check by selecting JSON Path Tester from the dropdown.
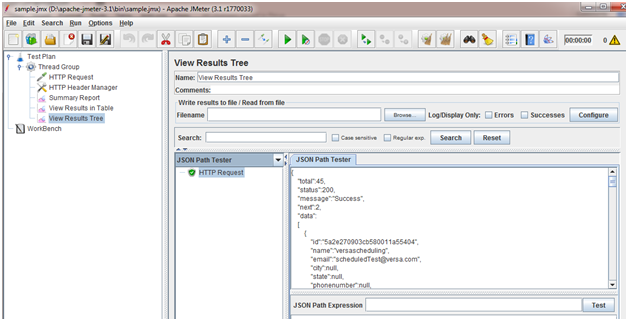
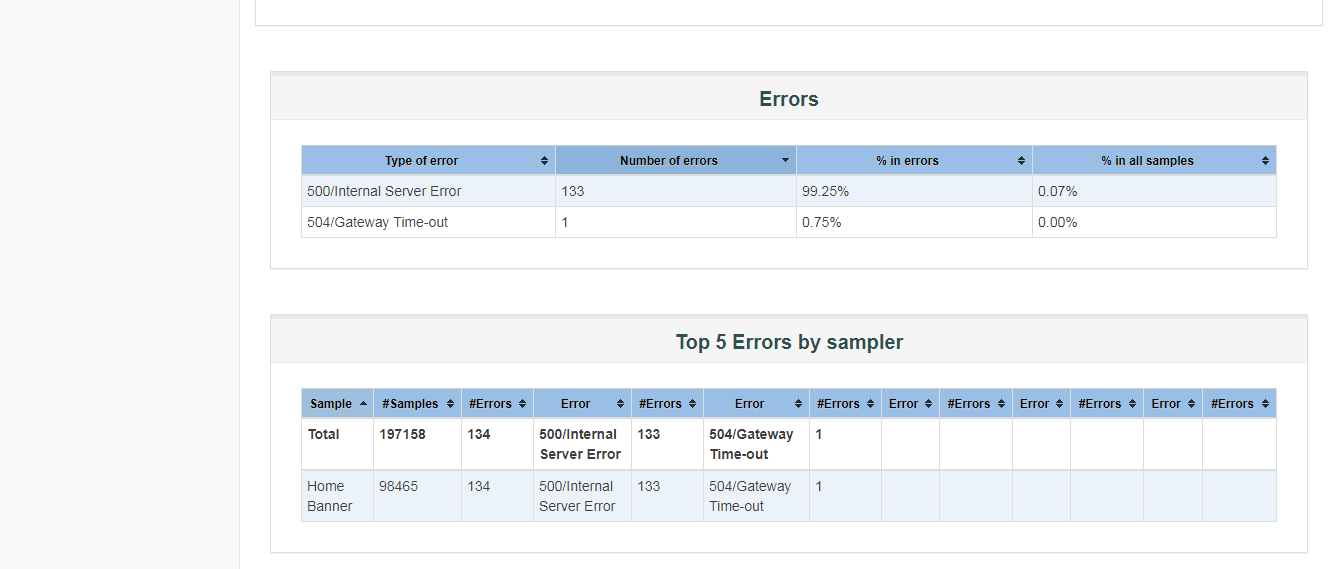
How to check the response is correct or not?
Following are the common response code
Great Blog!!! Thanks for sharing this wonderful data with us.
ReplyDeleteSoftware Testing Course in Chennai
Software Testing Online Course
Software Testing Course in Coimbatore
thank you
ReplyDeleteSAS Training
WordPress Training
R Programming Training
MIS Training
HTML,CSS,JQuery Training
Web Designing Training
Data Analytics Trainingp
PHP Training
Python Training
Data Analytics Training Delhi
ReplyDeletephp training in delhi
php training in noida
open source web development course
R Programming Training noida
Python training noida
Free python course
R programming training ghaziabad
PHP training ghaziabad
R programming training delhi
Python training in delhi
Data Analytics Training Noida
Python training in ghaziabad
full stack web development course
Such a nice blog with the reference links. Thanks for sharing with others.
ReplyDeleteSelenium Training Institute in Chennai
selenium online course
Best Selenium Training in Bangalore
features of webdrivers
Great Blog!!! Thanks for sharing this wonderful blog with us.
ReplyDeleteiOS Training in Chennai
iOS Online Training
iOS Training in Pune
Fantastic blog!!! Thanks for sharing with us, Waiting for your upcoming data.
ReplyDeletewhy is python so popular
why is python popular
Informative blog post on performance testing. Thanks for sharing this. Here are a few links for performance testers,
ReplyDeleteQA Job Board
Search QA Jobs
Performance Testing Jobs
Very Useful blog. Check our expert Performance Testing Company & all types of testing services in the USA .
ReplyDelete