 JMeter is Java desktop application, it requires a JVM(Java Virtual Machine) .
Download and install the latest version of Java SE Development Kit.
After installation Go to terminal & check java runtime environment is installed successfully by entering a command java -version
After installation Go to terminal & check java runtime environment is installed successfully by entering a command java -version
If You dont get output for the given command then reinstall the JRE.
Install apache-jmeter-5.4.1 version.
Unzip the zip file where You want the directory to be placed.
 |
| Install Jmeter in Windows |
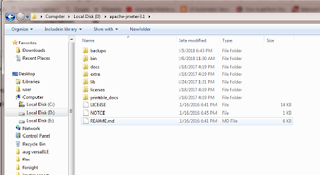
After unzipping you can see the folders inside the directory
/bin: contains JMeter script file for starting JMeter
/docs: JMeter documentation files
/extras: ant related extra files
/lib/: contains the required Java library for JMeter
/lib/ext: contains the core jar files for JMeter and the protocols
/lib/junit: Junit library used for JMeter
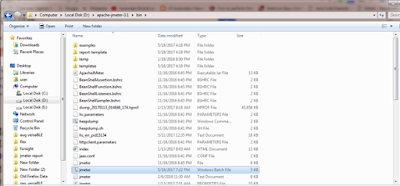
Go to the bin folder
You can check the folder for the jmeter batch file which You can open for windows but for linux ,select .sh file.
While launching You can see the exe file running on the background
How to create a Request ?
You can see the Test plan & the Work bench on the left top
Difference over Test Plan & Workbench-To create a Request & check for the response same way can be done through workbench but its a temporary storage comparing to test plan.
Right click on the Test Plan -Add-Threads-Thread Group
After selecting the Thread group You can see the Thread group for the Test Plan
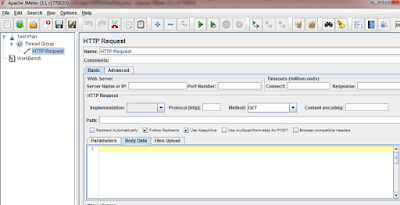
Right click on the Thread group & select Add->Sampler->HTTP Request
 |
| create http request |
After adding the HTTP Request, select the required method from the dropdown under HTTP Request.
Provide the URL in the Path field
Following are the common method types
Methods Scope
POST -> Create an object
GET -> Fetch/request object
PUT -> Update an object
DELETE -> Remove an object
Click on the Body Data & paste the Payload, if required for the request..
After adding the HTTP Request add Header manager by right clicking on the Add-Config Element-HTTP Header Manager
Add the Bearer Token after clicking on Add & the required headers for the respective API
Authorization:Bearer{token}
Content-Type: application/json
You can debug the token using debugger in the above link.Why we use token?
After adding the Header add the Listeners(Add-Listener-Summary Report ,View Results in Table & View Results ) to get & view the reports in the form which is required.
Click on the Green Play button at the top center to get the response for the added API request
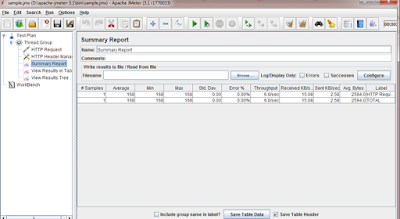
Click on the Summary Report to view the report after the run.
# Samples is the number of samples with the same label.
# Average is the average time of a set of results.
# 90% Line (90th Percentile) meaning 90% of the samples took no more than this time.
# Min is the shortest time for the samples with the same label
# Max is the longest time for the samples with the same label
# Error % is the percent of requests with errors
# Throughput is measured in requests per second/minute/hour.
# Kb/sec - throughput measured in Kilobytes per second. Time is in milliseconds.
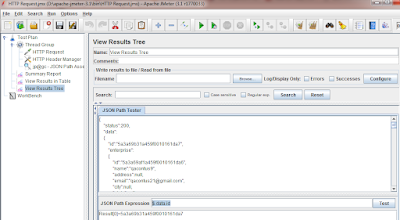
Click on the View Results Tree after run to check the exact response for the given request & check by selecting JSON Path Tester from the dropdown.
How to check the response is correct or not?
By adding Assertion with the thread group you can check the response with expected values for the response code(status) & response message.Using below Http request methods in Rest api
Following are the common response code
|
Status
code
|
Scope
|
|
200
|
Success /ok
|
|
400
|
The server cannot or will not
process the request due to an apparent client error (e.g., malformed request
syntax, size too large, invalid request message framing, or deceptive request
routing)
Request error (like required
validation)
|
|
403
|
Forbidden request(If
authentication fails and the requested method type is not allowed)
|
|
404
|
Data does not exists - Not found
|
|
422
|
Unprocessable entity (When the
field data is in improper format and unable to process the data for request)
|
|
503
|
Service Unavailable(For eg: when
user
unable to delete the speed check
network logs, it is because of server down due to maintenance)
|
|
504
|
Gateway timeout (for example ,
when user details get updated
in saas and not updated in
magento request due to request processing timeout error)
|
|
500
|
Internal server error
|
How can i add the assertion to the request?
1.Response Assertion
Add->Assertions->Response Assertion
In the response assertion You can make use of Response field to test Test Response,Text,URL Sample,Response code,Response Message,response Header,Ignore status.
1).Text Response - Provide the text in the body of the response.
2) Response code - Provide the response code ,Select the response code checkbox, click Add & Provide the expected response code.
3) Response Message - Provide the response message,Select the response message,click Add & Provide the expected response message.
4) JSON Path Assertion
Select & add the JSON Path Extractor to get the expected value over the response
Add->Assertions->jp@gc-JSON Path Assertion
Provide the JSON path,& the expected value in the corresponding fields
If You are getting the response like below in the JSON Path Tester then You can check whether the given expression is correct or not by building the path in the JSON path expression
Example:
1.If You want to assert the id with the response then You can give “$.data.id”.
2.Click Test.
3.If You get the result, then you have provided correct path expression.
4.Take that path expression & paste it over the JSON Path (Check the previous screenshot).
5.Provide the id value in the Expected value field.
 JMeter is Java desktop application, it requires a JVM(Java Virtual Machine) .








No comments:
Post a Comment